> ## Documentation Index
> Fetch the complete documentation index at: https://docs.athina.ai/llms.txt
> Use this file to discover all available pages before exploring further.
# View Annotated Data
> Learn how to inspect completed annotations and monitor dataset coverage.
Once your annotation project is active, Athina provides tools to monitor label distribution, agreement, and project progress in real time.
***
## Navigate to the Annotation Project
1. Go to the **Annotations** tab from the sidebar.
2. Select your project.
3. Use the tabs to explore:
* **Subsets**: Filter by specific dataset segments.
* **Annotators**: Monitor per-user progress and agreement.
* **Settings**: View or update the view configuration or guidelines.
***
## Annotators Tab – Progress and Agreement
The **Annotators** tab summarizes team-level annotation status.
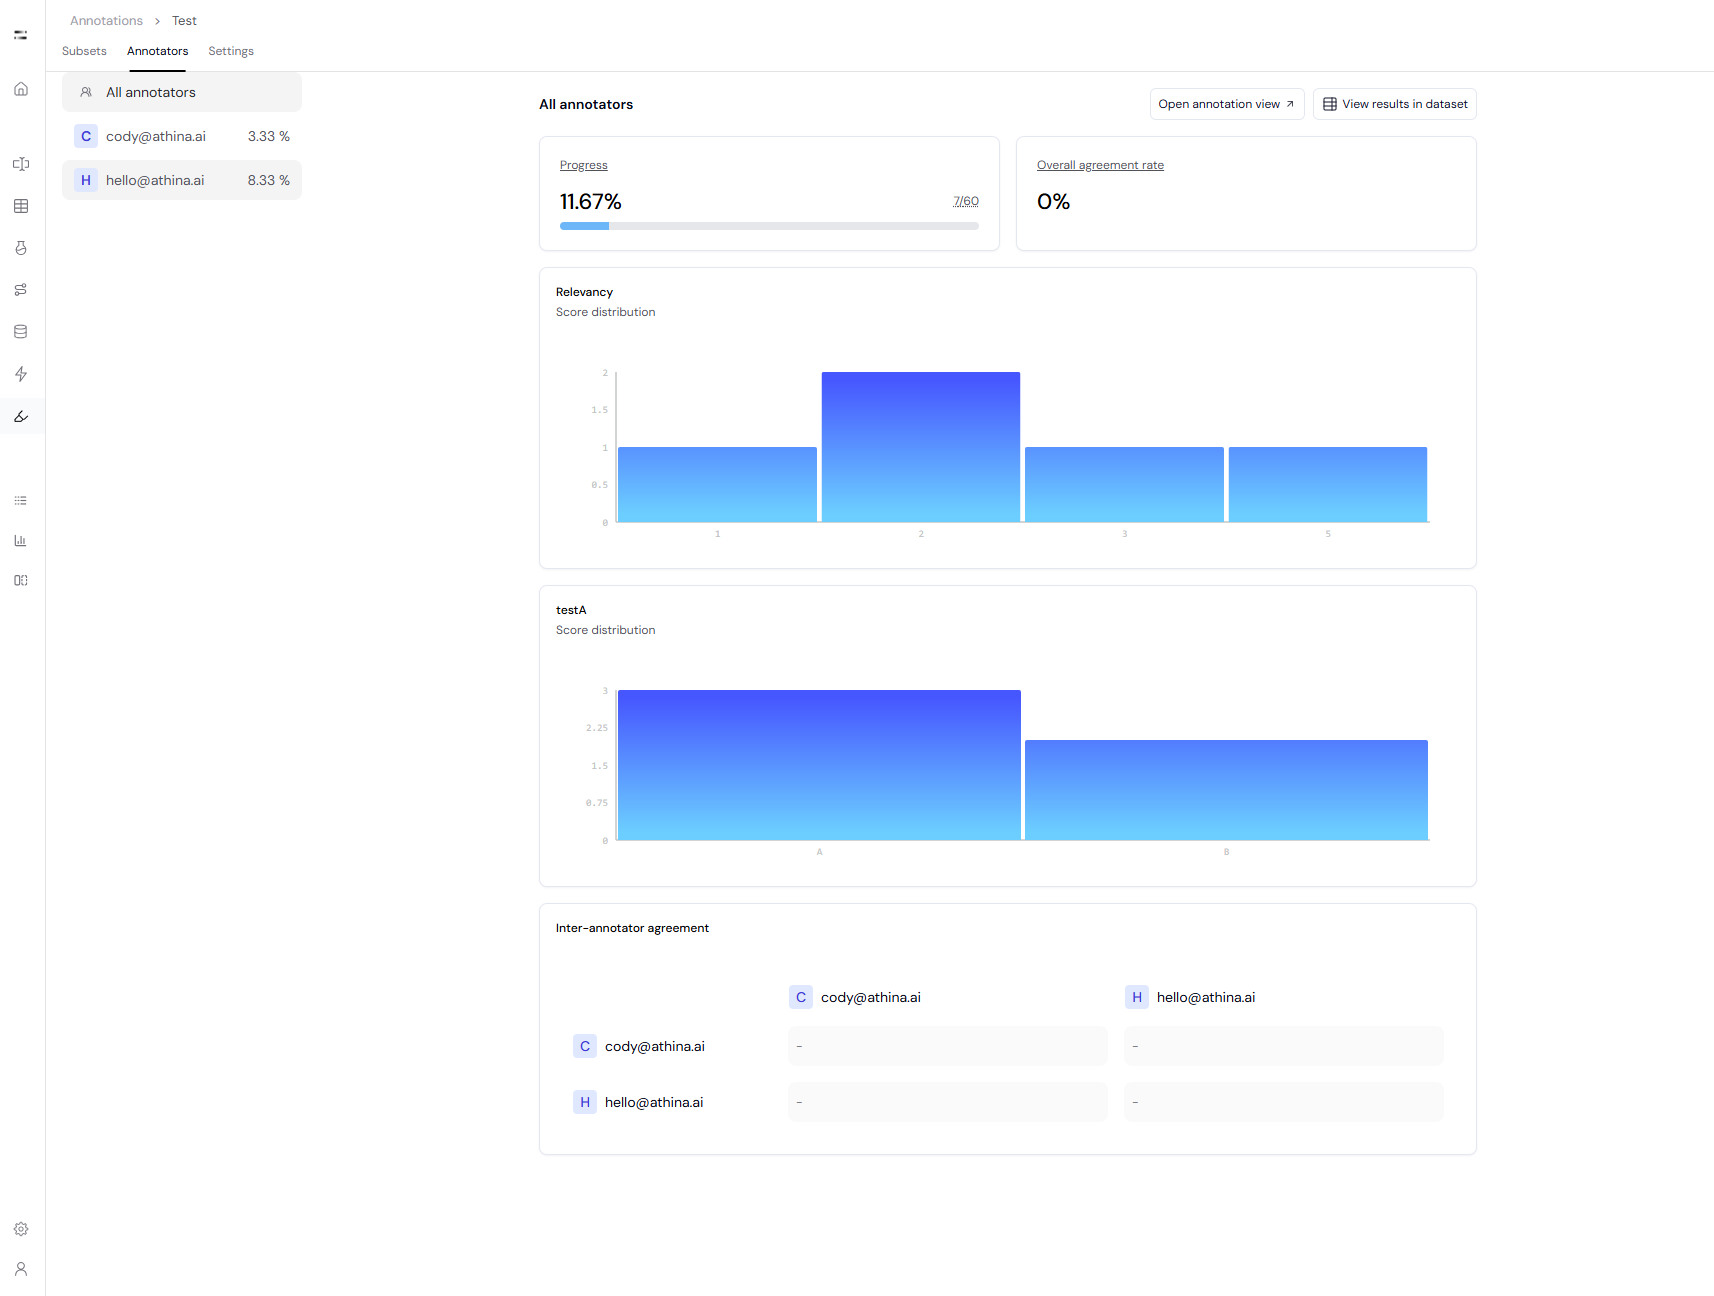
You can view:
* **Overall Project Progress**: Percentage of datapoints completed based on the required number of annotations.
* **Overall Agreement Rate**: Metric that tracks label consistency across annotators.
* **Score Distributions** for each label (e.g. "Relevancy", "testA").
* **Inter-Annotator Agreement Matrix**: Pairwise agreement comparisons between annotators.
Use these metrics to spot potential labeling inconsistencies and train annotators accordingly.
***
## Open the Annotation View
Click **Open annotation view** to start annotating or reviewing entries.
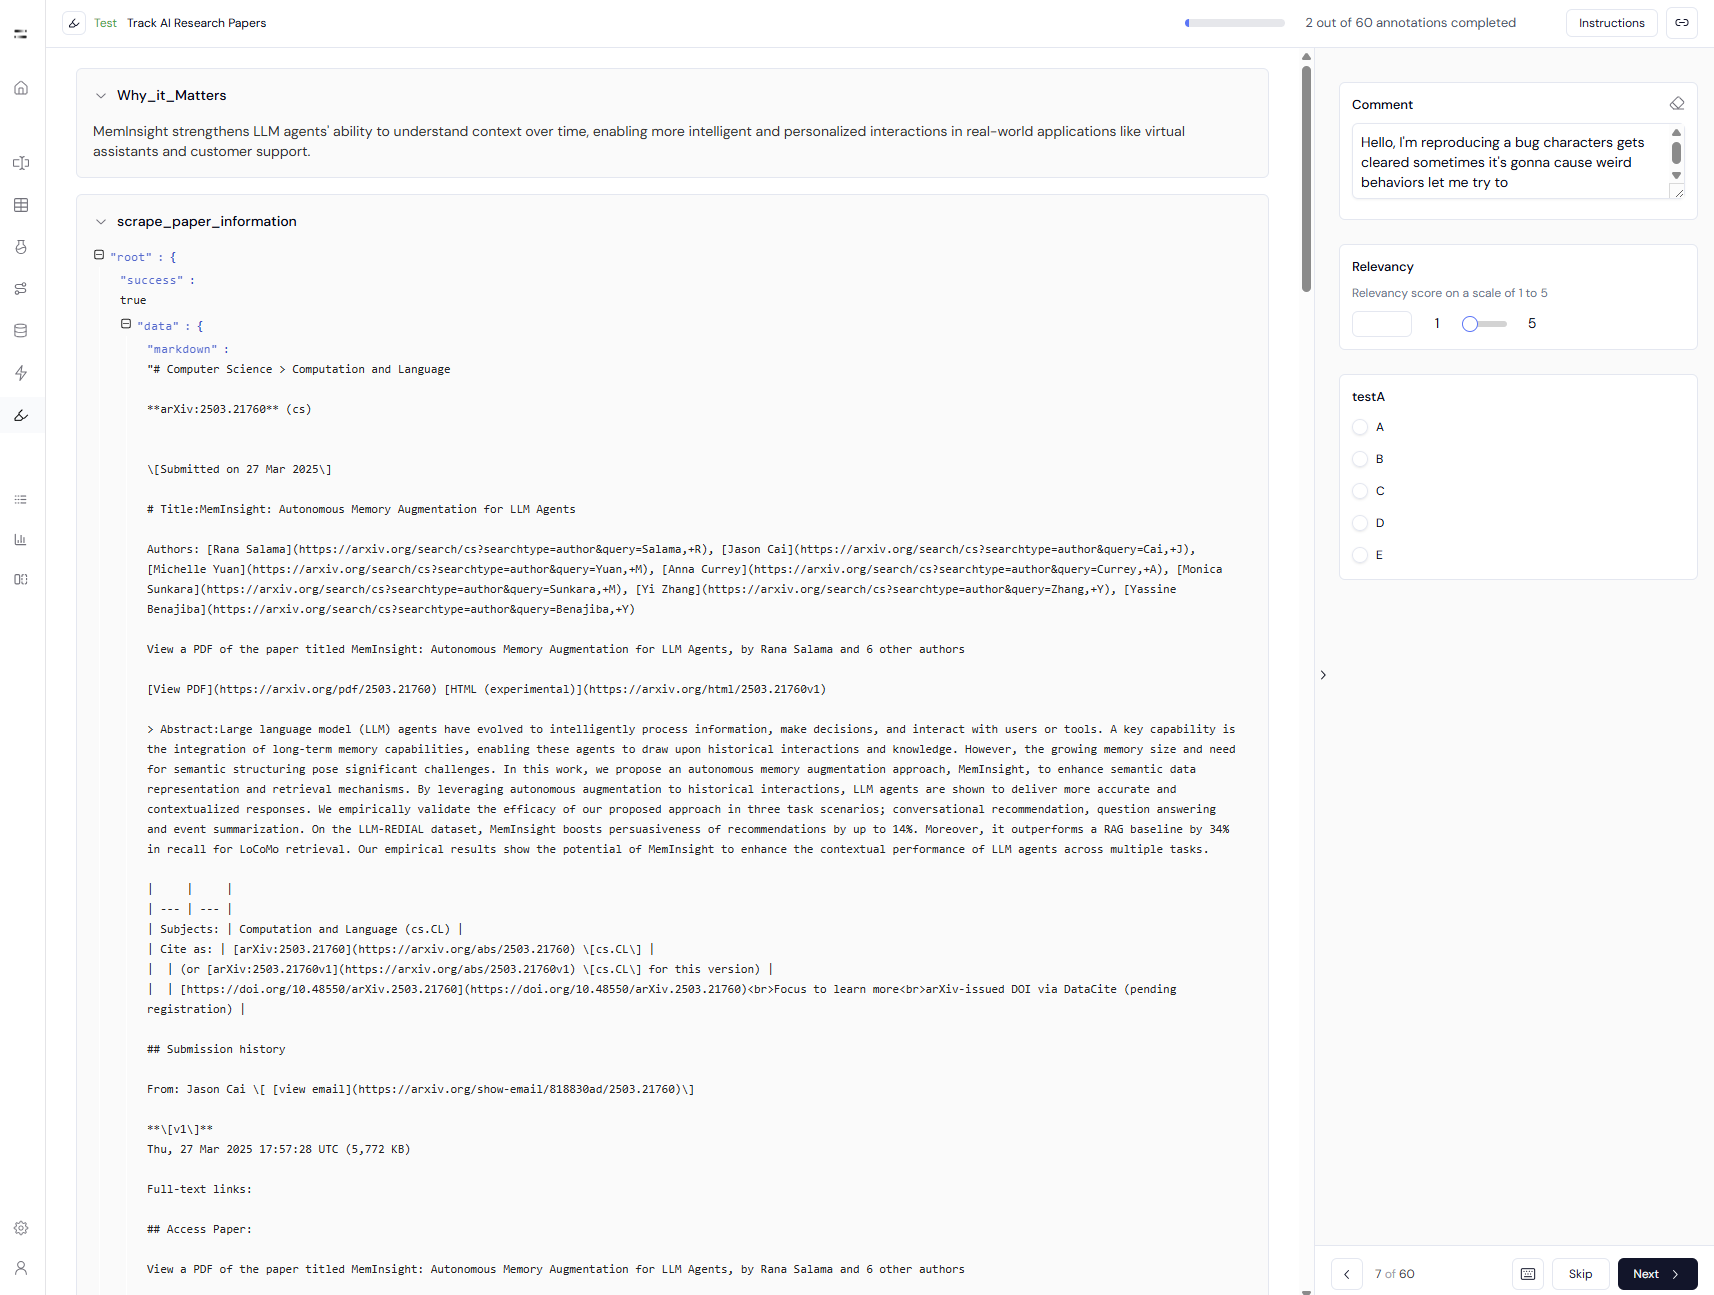
* The view layout is determined by the selected **Annotation View Configuration** in the project.
* Fields can include markdown-rendered text, structured inputs, and contextual sections.
***
## Annotation Interface
* **Navigation**:
* Use **Next**, **Previous**, or **Skip** to move between datapoints.
* **Labeling**:
* Annotators fill in labels as defined in the configuration (e.g. dropdowns, sliders, text areas).
* **Instructions**:
* Click **Instructions** at the top right to reference guidelines at any time.
There is no toggling between different states — annotators label entries one by one using navigation buttons.
***
## Filtering and Data Access
While reviewing in the main dashboard:
* Use **Subsets** and **Annotators** tabs to filter views.
* Click **View results in dataset** to switch to the dataset’s Sheet view and inspect raw + annotated data.
***
Keep annotation view configurations minimal and focused to streamline annotator flow and reduce errors.