Athina allows you to inspect completed annotations directly in the dataset view. This is especially useful for manual review, identifying edge cases, or resolving inconsistencies between annotators.
Open Dataset Sheet View
- Go to the Datasets page.
- Select the dataset associated with your annotation project.
- Switch to the Sheet tab to see annotations inline with original content.
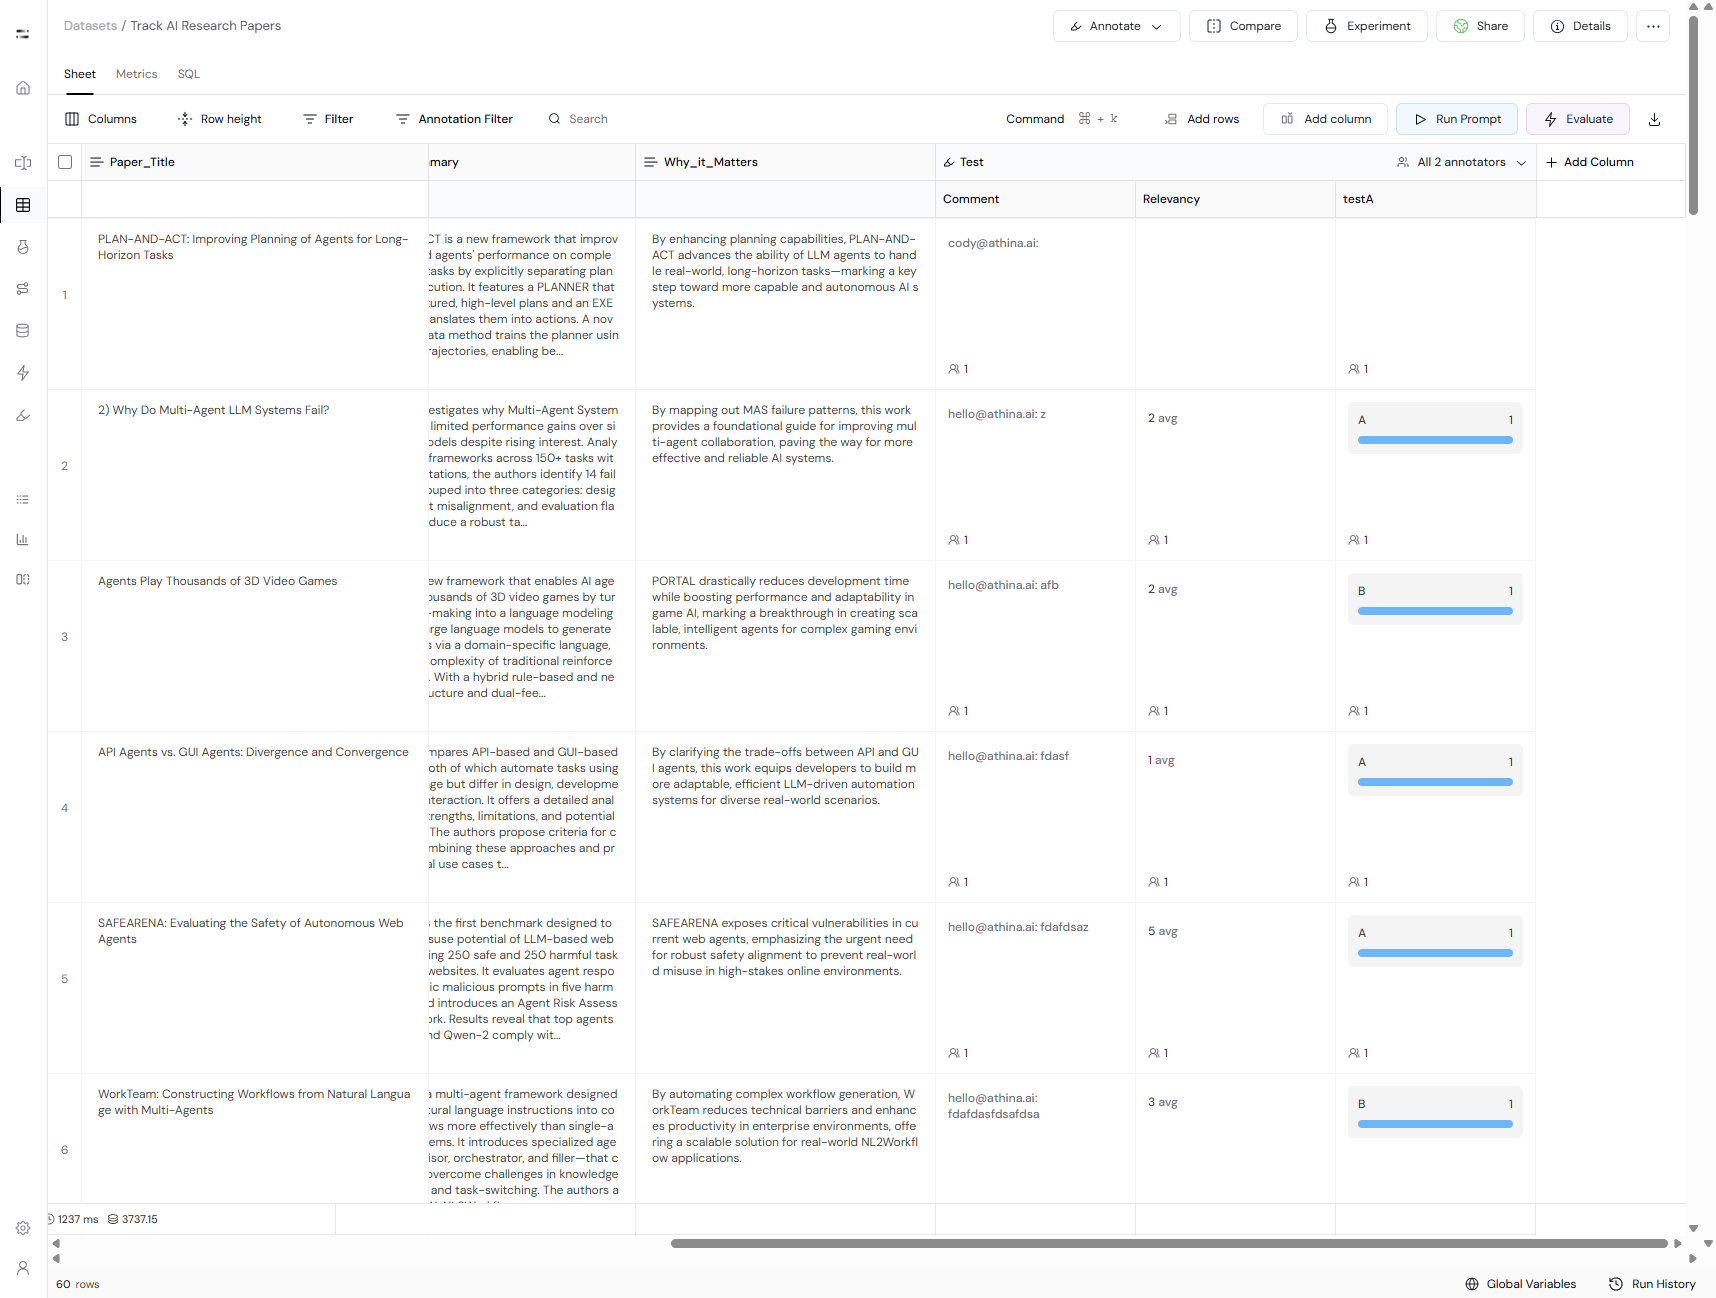
What You’ll See
In the Sheet view, you’ll be able to:
- View original input fields and annotation labels side-by-side.
- See all annotations per datapoint across annotators (e.g. “Relevancy”, “Comment”, “testA”).
- Use the Annotation Filter to filter by annotator, label values, or disagreement.
- View average or aggregated labels if configured (e.g. mean score for numeric values).
Common Use Cases
- Manual QA: Check for unexpected values, outliers, or annotator errors.
- Disagreement Resolution: Look at how labels differ between users and determine the ground truth.
- Export Preparation: Apply filters before exporting a clean, validated dataset.
Tips
- Use the Filter or Annotation Filter options to narrow down to rows with disagreement or edge-case values.
- Add custom columns (e.g. “Resolved Label”) to track adjudicated or finalized annotations.
- You can still access annotator-level metrics via the Metrics tab for a high-level summary.
For full control over review, create a column like final_label and populate it manually after reviewing annotator inputs.